This new report offers practical tips for using data and dashboards to support shared mobility policies, highlighting key lessons from cities on standardisation, visualisation, and decision-making.
The ‘Di’ in ShareDiMobiHub
Shared mobility and mobility hubs are an increasingly common sight in our cities. While their presence was relatively modest until about a decade ago, it is now challenging to find an urban area without scooter, bike or car sharing services, or a (developing) network of mobility hubs. As these services expand and their usage grows, new questions emerge: How can we digitally bundle this range of services? How will we monitor and visualise their usage? How do we formulate policies based on data?
In this deliverable, we focus on an aspect that, while not highly visible, is crucial for any shared mobility policy: data and dashboards! Aimed at policymakers, we delve into the 'Di' in 'ShareDiMobiHub' (Shared and Digital Mobility Hubs) by presenting real world examples from the project across four chapters. To conclude the study, we summarise our findings into comprehensive do’s and don’ts.
What we discuss
We begin by introducing ‘data’ and ‘data exchange’. Our focus then shifts to the data needs of the Capital Region of Copenhagen. We introduce the TOMP-API as a standard for data communication between transport operators and MaaS providers, and delve deeper into how Mpact and the TOMP Working Group keep this API top-of-mind among policy makers, software architects, and mobility providers.
The second chapter addresses the data that public authorities require and gather. It includes insights from workshops organised by the University of Applied Sciences Utrecht, recommendations developed by Way To Go for the Flemish Agency for Home Affairs, and perspectives from the data & digitalisation strategy of the City of Leuven.
The third chapter is dedicated to the visualisation of (shared) mobility data. We examine the Belgian 'shared mobility dashboard,' explore why and how Vestfold County and the City of Leuven utilise existing software packages for data visualisation, and present some inspiring dashboards from outside the ShareDiMobiHub project.
The final chapter demonstrates how data can be put to work. We present the Impact Analysis Tool designed to estimate the positive impacts of shared mobility, illustrate the way in which the City of Amsterdam makes data-driven decisions with providers, and showcase how the Transport Authority for the Amsterdam Region uses data to identify hub locations.
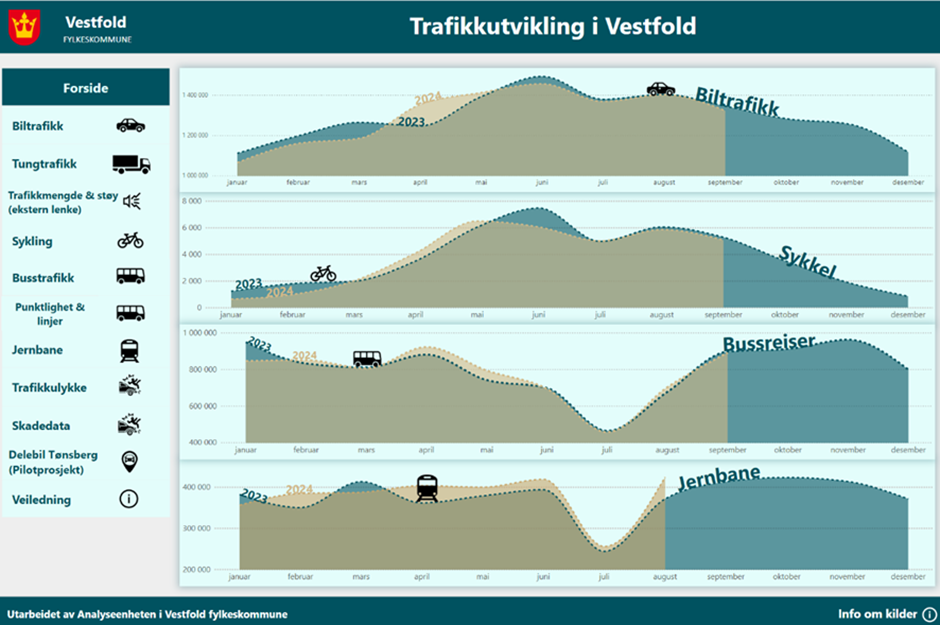
The Mobility Data Dashboard developed by Vestfold County using Microsoft Power BI (Source: Vestfold County).
Data and Dashboards, Do’s and Don'ts
We understand that not everybody has the time to read the entire study. We have therefore summarised our main learnings in the shape of five do’s and don’ts. These are based on real-world examples from the public authorities and associations involved in the ShareDiMobiHub project:
Do not ask for data just because you can. Do make use of them for planning and decision making.
Do not underestimate the importance of data and data exchange. Do stress how they benefit all stakeholders in the mobility ecosystem.
Do not hide your stash of data. Do share them when useful for communication purposes and awareness-raising.
Do not reinvent the wheel. Do make use of existing software packages or platforms.
Do not just push a standard or a dashboard. Do take the interests and insights of all stakeholders into account and provide support.
For each takeaway, we have included a brief description along with links to relevant sections in the deliverable. This allows you to explore the topics that interest you or your organisation in greater depth.
We believe that our real-world examples and project insights can inspire any public authority that is currently developing, or wishes to develop and/or monitor its shared modes and mobility hubs. You can explore the study via this link.
‘Data and Dashboards, Do’s and Don’ts’ was edited by Jelten Baguet from Mpact, a Belgian shared mobility incubator and operator. For any questions regarding this deliverable, feel free to reach out to him at Jelten.Baguet@mpact.be.
Acknowledgements
The editor would like to express his gratitude to all the co-authors for their timely and valuable contributions. Both the authors and the editor extend their thanks to the POLIS Network for the layout of the document.