
The figure presented here shows a couple of so-called Jellyfish plots. Together they summarise all sky brightness measurements (so far) in just one graph, which provides us with a nice overview. Here, each point in the plots represents a single measurement.
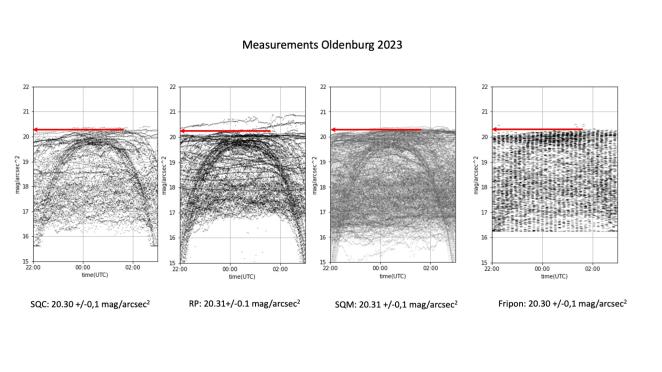
Clear nights usually form a group around a band at the highest mag/arcsec2 values. They are often used as an indicator for the sky quality. A natural unpolluted sky should, for instance, reach values up to about 22 mag/arcsec2. In Oldenburg we reach values of around 20.2 mag/arcsec2, which can be considered quite typical for a polluted city periphery.
What is particularly important to us, is that all four detectors used at the Oldenburg measurement site (SQC, SQM, KID-RP and Fripon) reach the same maximum value. This suggests that all detectors can be validly used to estimate the sky quality. Which detector is the best and most accurate? Well, this is one of the key questions, whose possible answers are widely discussed among experts. For the moment, though, we can state that the detectors can allbe used to measure the darkness!