
Within the MEGABITS project the province of Antwerp is working to develop innovative solutions for safer and smarter mobility.
One of the most promising experiments is their Data Fusion pilot, which combines cyclists’ subjective experiences with objective tracking data. The goal? To gain better insights into hazardous spots along the F106 Herentals–Aarschot cycle highway, which will be upgraded to a state-of-the-art route in the coming years.
Participation approach
Traditionally, cycle highway designers rely on their own studies and experiences to identify problem areas. But how accurate is that picture? To have a better understanding of the existing cycle highway, a participation platform was created where users and neighbours of the F106 cycle highway could give feedback about their experiences along the track. Over 500 users left their comments and identified over 660 situations to have a closer look on.
Why data fusion?
By linking the information from the participation platform to data from cycling apps like Geovelo (=Floating Bike Data (FBD)), a more complete and objective view of cyclist behavior on the ground is created.
The hypothesis: locations where cyclists feel unsafe (subjective) also show more stops or sudden braking (objective). The Province tested this by correlating both datasets geographically.
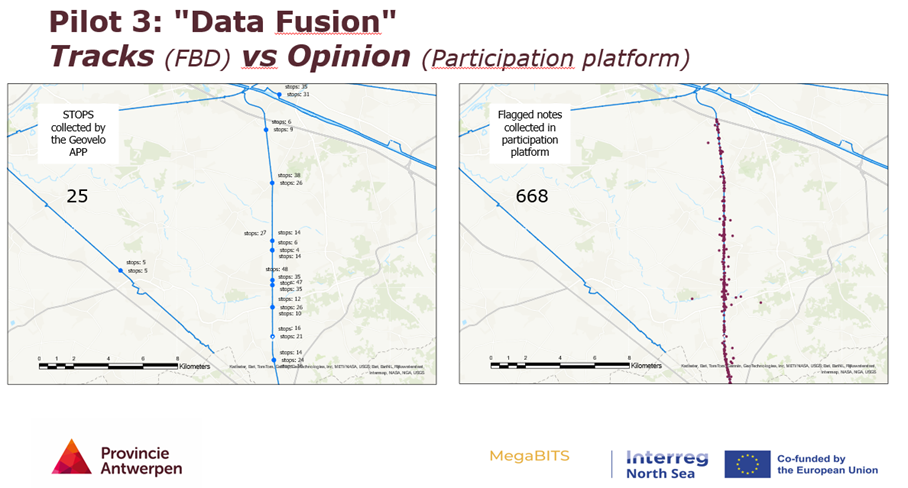
Figure 1: on the left are the collected stops by the tracking app , on the right the notes from the participation platform are displayed.
What was found out?
- Strong correlation at specific intersections: Locations with many danger reports also showed frequent abrupt stops, confirming that subjective reports are often valid.
- Exceptions exist:
- Intersection Harmoniestraat: frequent stops, but not due to traffic—cyclists park here for ice cream at a local shop.
- Intersection Madestraat: many danger reports, but no stops. Possibly due to limited representativity of tracking data.
- Local knowledge remains crucial: data analysis alone is not enough; contextual knowledge is needed to explain anomalies.
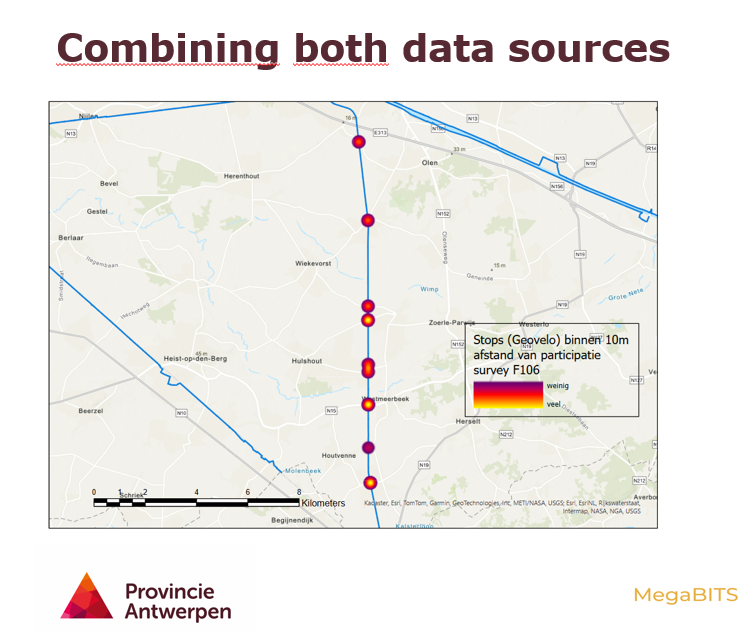
Figure 2: correlation: locations with a lot of danger reports also show frequent abrupt stops .
Limitations and challenges
- Representativity: over 500 people completed the survey, but only a quarter of them installed the tracking app. Moreover, the top 10 cyclists accounted for over 50% of all tracked kilometers, skewing the overall picture.
- Data quality: GPS accuracy and subjective location marking can vary.
- Added value: for the F106 design process, tracking data (Floating Bike Data) mainly confirmed existing insights rather than revealing new hazards.
What does this mean for the future?
For their case of redesigning an existing cycle highway, the province of Antwerp learned the following from the Data Fusion pilot:
Floating Bike Data did not deliver groundbreaking insights for this project but it did confirm the insights that were learned by using the participation platform. Moreover, it identified the intersections on which the design team will need to have a closer look to ensure future road safety. For detailed intersection analysis, additional research will be needed.
Cover Photo by Yanni Roua on Unsplash, Data Fusion pictures by the Province of Antwerp
Find or showcase connected mobility solutions for free in the BITS Directory .