
One way to do this, is to hypothetically demonstrate what the effects of the measures would be. This is possible by the development of a powerful traffic potential tool.
Making cycling safer could possibly mean less, and less severe accidents. Lowering speed in the centre of the municipality could delay or not delay your trip. Creating better cycling infrastructure would allow shorter cycling trips, both in distance or time and therefore become a better alternative for the car. If we can model these measures, we can also measure their effects on traffic speed, intensity, safety, and sustainability, even an estimated modal shift.
To accomplish this, the province of Antwerp engaged MINT, a Belgian company specialised in studies on traffic and mobility and MoveMobility, a Dutch company to develop together a customised version of the online tool, the MoveMeter.
Quality
Obviously, the model can only be convincing if the input data is relevant and accurate. Also, we must tell the right story so that expectations are in line with the modelled accuracy. We don’t want garbage in garbage out and the method must be transparent.
The province of Antwerp has a large dataset on the quality of cycle infrastructure of a limited network (the so-called supralocal functional cycling network, or in dutch – het bovenlokaal functioneel fietsroutenetwerk). To obtain a more complete network on cycling, this limited dataset was fused on a copy of the existing OpenStreetMap data, thus creating a quality label on the presence of cycle paths, cycle streets, bridges and tunnel.
These networks were then hypothetically populated with traffic (bicycle, car and freight) for one hour of the morning and evening peak. This traffic was extracted from the Strategic Persons Model 4.2.3 Flanders, developed by the department of Mobility and Public Works of the Flemish Government, also in collaboration with MINT. In this model one can find a number of movements matrices for bicycle, car and freight between zones of origin and destination, based on real patterns of movement between inhabitants, places of employment, schooling and other attraction poles. All traffic is then distributed on the available roads and bicycle infrastructure for the most -time efficient trip between zones which take into account the allowed direction, allocated comfort, type of infrastructure, speed limit and the capacity of the road.
On the downside, the resolution of the model is a trade off with the scale of the region in the model. This means that for the province of Antwerp (2.856 km2), and a buffer around it to incorporate incoming and outgoing traffic, the road network with modelled traffic is restricted to the higher road categories. Since our primary focus is on the impact of bicycle, the cycling network is available in much higher resolution, but again, not the entire available network. Much like the road network, the number and resolution of the origin/destination zones is relatively low, making the tool more valuable for large scale projects for bicycle (a new cycle highway) than for example to visualize the effect of a local traffic filter on motorized traffic. Also, the location of centroids of the zones containing the origin and destination data also defines how and from where the traffic is distributed over the above network, meaning that on a more local scale the actual development of traffic may divert from the modelled.
To compensate such a diversion between model and reality, the challenge is to find a balance. The base model can always be calibrated slightly towards a more realistic scenario, but the model should never be manipulated to a desired outcome, by for example exaggerating the speed one can reach on a cycle highway.
Use case: A new cycle highway?
We will present one use case. Between the city of Lier and Aarschot, a new cycle highway is in progress, the F104. This cycle highway will be constructed in separate segments or clusters. With the MoveMeter we can evaluate the added value of each segment vs the existing situation thus helping to prioritise the sequence of these clusters.
We also modelled a cluster as a sequence of ‘bicycle streets or fietsstraten’, with a slightly adjusted speed and priority regulation.
Equally a sensitivity test was performed in which we compared a situation where you could cycle at 30km/u continuously versus another where you could cycle at 25km/u.
Below you can see the intensities in the morning peak between the base scenario and three of our hypothetical scenarios, one with only cluster 2, one with cluster 1 and 2 and another with cluster 2 and 3.
| Base | Cluster 2 | Cluster 2 and 3 | Cluster 1 and 2 |
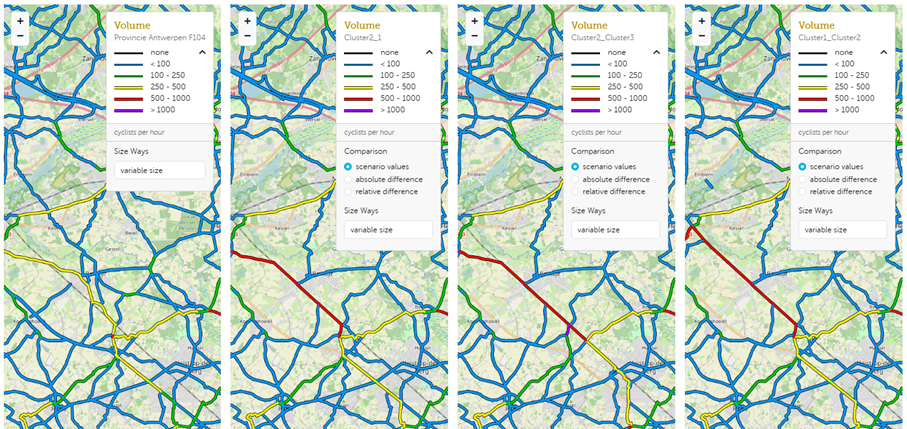
Figure 1: base, cluster 2, cluster 2 and 3, cluster 1 and 2, volume of bicycles in morning peak
We also visualised this as a modal shift between the departure/arrival of zones
| Base | Cluster 2 | Cluster 2 and 3 | Cluster 1 and 2 |
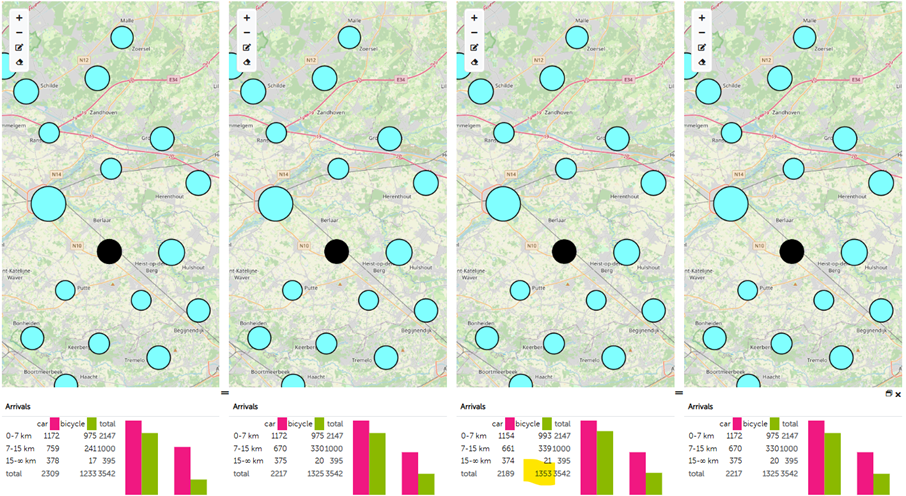
Figure 2: departures and arrivals by car and bicycle for base scenario, cluster 2, cluster 2 and 3, cluster 1 and 2
From a modal shift ambition, the combination cluster 2 and 3 attracts most cyclists, although one could argue that cluster 2 would already make a huge difference and we would argue to start with cluster 2.
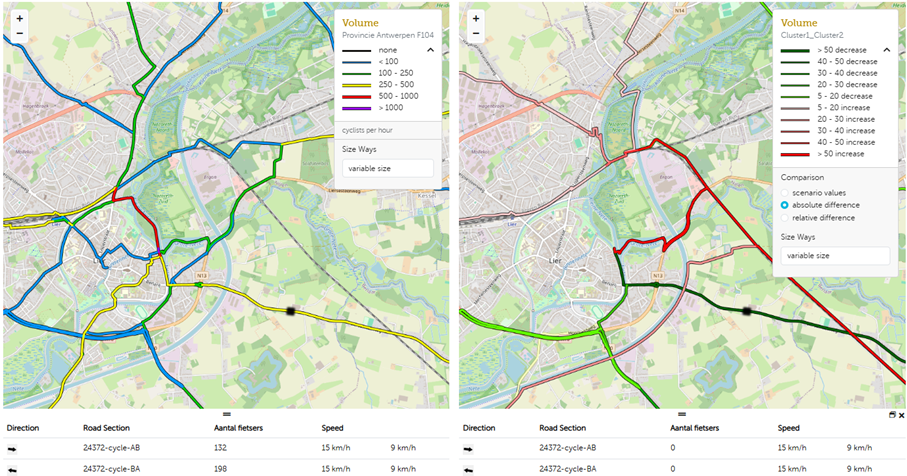
Figure 3: Bicycle traffic volume in morning peak in base scenario and scenario cluster 1 and 2
Scenario cluster 1 and 2 however would provide cyclists from the city of Lier with a large safety benefit, in that the cycle highway would be mostly preferred over a dangerous and uncomfortable 70km/u secondary road that is used now, as we know from the measuring bike data. In the figure above all cyclists would choose the cycle highway over a dangerous secondary road they use today.
Future:
Options to be considered.
- The smart fusion of modelled traffic data to bicycle counters, floating car and bike data to reach a more realistic and more detailed view on existing traffic.
- Public transport data (the option is already available) to improve the optional modal shift tool.
- Parking data, so that effects of measures in parking could be visualised.
- More regional strategic traffic models, rather than the Flemish, so that smaller scale measures can be evaluated on a more detailed scale.
Conclusion
The MoveMeter is at the same time a quickscan and a very valuable tool to hypothetically model future plans for cycling infrastructure and other measures for more sustainable traffic on a large scale . Further work on the quality and scale of the source data could improve this tool even more and support a highly data-driven policy as a decision tool, always keeping in mind the limits of the model and its efficiency.