
How Zwolle Uses Digital Technology to Improve Cycling Safety
The municipality of Zwolle uses the Digital Twin Zwolle (DTZ), a digital replica of the city in which urban data from various domains is combined into a single model. For MegaBITS, additional cycling data has been incorporated. This makes bicycle-related information centrally accessible and integrally visible. At the same time, a lighting analysis tool has been developed to map the current state of public-space lighting and identify potentially high-risk locations for cyclists. The analysis considers the roads and cycling paths within the boundaries of the municipality of Zwolle.
The Pilot: From Data to Insight
When public spaces are redesigned or expanded, lighting is typically calculated in advance with software such as Dialux. In the existing city - where such calculations have not been made beforehand - the lighting analysis tool provides a valuable addition. It enables proactive identification of potentially risky locations instead of reacting only after reports or incidents occur.
In the pilot, data from the DTZ was used, including the layout of cycling paths and roads, the locations of lighting poles, pole height, lumen output, and lens types. Within built-up areas, the focus was on measuring light levels and lighting uniformity, particularly in conflict zones where cyclists and motor vehicles intersect. Outside urban areas, the analysis centred on dark zones, where the risk of accidents is higher. Such dark areas may also evoke feelings of insecurity.
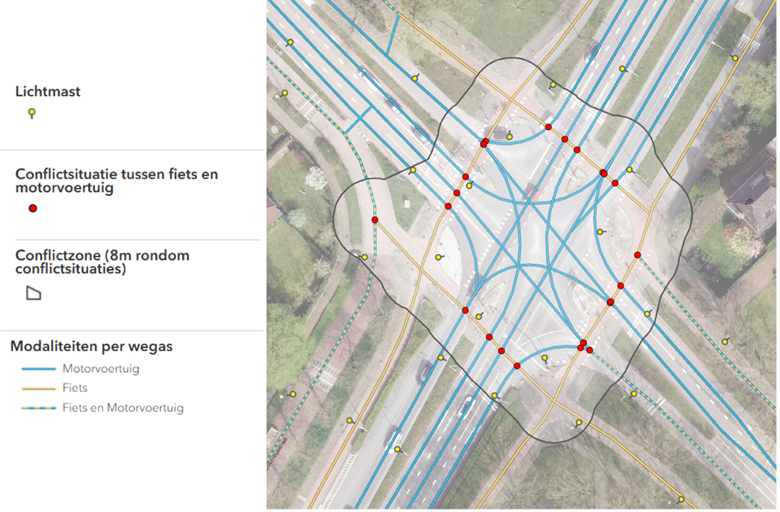
Figure1: City of Zwolle
The tool provides both objective data and insights into perceived safety. Lighting is only one aspect of traffic safety; a well-lit intersection may still be unsafe due to other factors. The tool therefore only flags potential risk locations where lighting may be insufficient, creating a targeted starting point for specialists.
Results and Applications
The analysis clearly shows which locations are well lit and which are not. Identified risk locations are examined further with Dialux. Notably, the tool proved highly accurate in approximating a full lighting calculation based solely on data about lighting poles and coordinates. This resulted in a reliable and recognisable representation of light distribution, displayed on user-friendly maps.
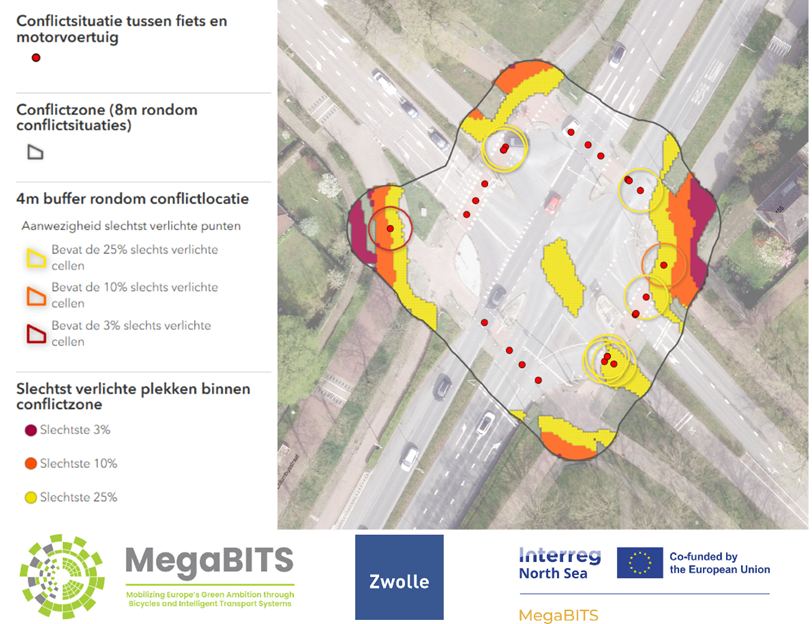
Figure 2: City of Zwolle
A major strength of the approach lies in combining multiple data sources. By linking the results to citizen reports, a more objective overview emerges and priorities can be set more effectively. The visualisations of rural areas were particularly insightful: they showed logically explainable patterns of light and dark zones. Interpreting results in built-up areas was more challenging due to smaller scale and a necessarily more coarse approach. Even so, compared with the pre-pilot situation, the tool represents a clear improvement.
Attention to Interpretation and Use
Maps can give a distorted impression when viewed without context. It is therefore essential that they are used only by specialists with relevant expertise, accompanied by clear explanation and a disclaimer. The tool provides a fast and reliable analysis using existing data at the press of a button. It does not deliver a definitive verdict on traffic safety, but flags poorly lit or potentially risky locations that warrant further investigation. Even without accounting for elements such as trees, the analysis is accurate enough to identify risk areas.
The tool also offers room for expansion - for example by incorporating the influence of trees or future spatial developments. The approach is scalable and is being gradually rolled out across Zwolle.
Conclusion: A Valuable Addition
The Lighting Analysis project delivers deep insights into Zwolle’s public lighting and contributes to cycling safety. Through innovative technology, lighting issues can be identified quickly and efficiently, whereas previously this required significant time. Especially in existing neighbourhoods, the tool provides a powerful starting point for broader safety analyses. The results are reliable and directly applicable for decision-making on lighting, without the need for specialist software for each individual location. Thanks to its scalable and efficient approach, the tool aligns well with existing municipal workflows and offers a valuable addition for local authorities looking to use data-driven methods to create safer public spaces.
Text by Mette Bekkering. For the Dutch article, click here.
Cover photo by Karthick Gislen on Unsplash, study pitures by the City of Zwolle.
Find or showcase connected mobility solutions for free in the BITS Directory .