
Our Project Partner, the city of Enschede, uses traffic light controllers (TLCs) across the city’s network to provide detailed information on vehicle and cyclist flows, waiting times, and intersection performance. By analysing this data, city planners can assess traffic conditions, identify bottlenecks, and optimize signal timing to improve travel times and safety for all road users.

Traffic light controllers in Enschede.
Data from all traffic light controllers (TLCs) in Enschede is collected through the city’s network. For counts, this includes all loops visible in the siteview below. Numbers can be provided per 5 minutes, per quarter-hour, per hour, or as daily totals. The data is stored for historical reference, allowing retrieval even from past years.
In Enschede, there are 56 traffic lights spread across six network sections. A monthly report is published that examines intersection-level traffic and travel times.
Intersection level:
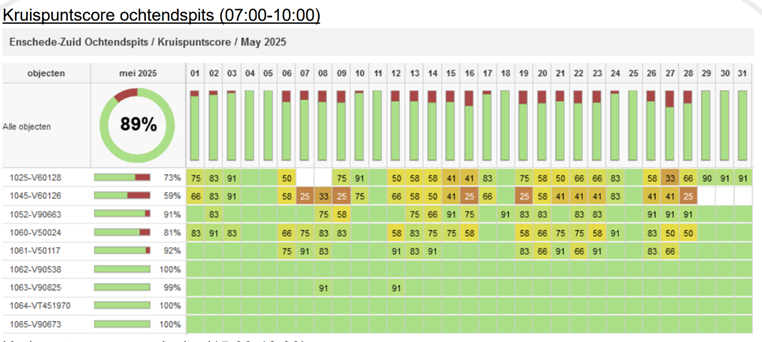
This section examines the morning and evening rush hours. An intersection score is calculated using various KPIs.
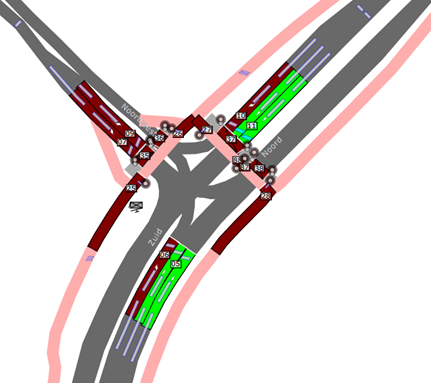
In this example, Enschede South (1 of 6 strands) is shown, where all TLC (“objects”) are given a score.
For cyclists it looks like this:
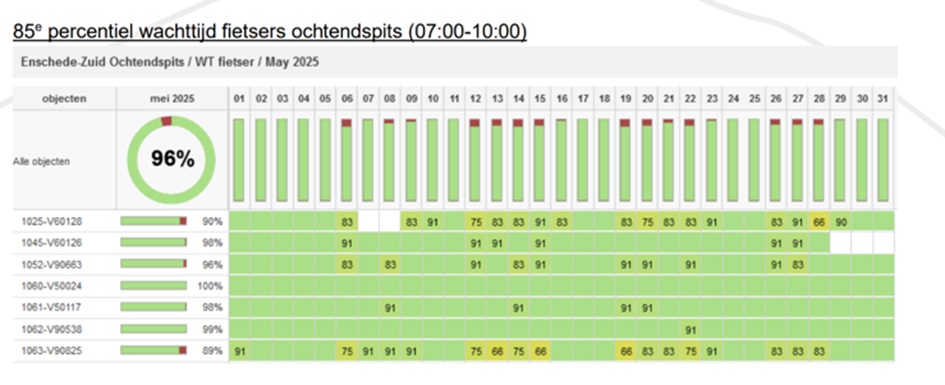
A KPI of 81 seconds is used as the maximum waiting time for cyclists. The table provides an overview of how often this limit is exceeded.
A corresponding graph illustrates intersection load and waiting time. The limit value is 81 seconds, and the graph indicates that almost all cyclists at this intersection this month received a green light within 81 seconds.

Similar tables and graphs are available for pedestrians and car traffic. Performance management covers all transport modes, showing the number of exceedances and potential causes, such as emergency responses.
If the trend indicates an increasing number of exceedances, parameter adjustments can be implemented. The following month, the effect of these adjustments can be immediately observed. Steering more on a bicycle can have impacts on cars, pedestrians, or buses, so it is important to consider all modes of transport to achieve an optimal setup.
Continuous evaluation and measures aim to maintain high intersection scores and low travel times. Using cycling data, waiting times for cyclists are kept short, and cyclists’ travel times can also be monitored via the dashboard of the Enschede Fietst app.
Photos by City of Enschede
Find or showcase connected mobility solutions for free in the BITS Directory .