Image

Image
15/12/2025
1 minute
Last week, 6 students of the Technical University of Hamburg, presented their work to the CLOSECYCLE partners. They visualized the pilots and streams and processes.
Image
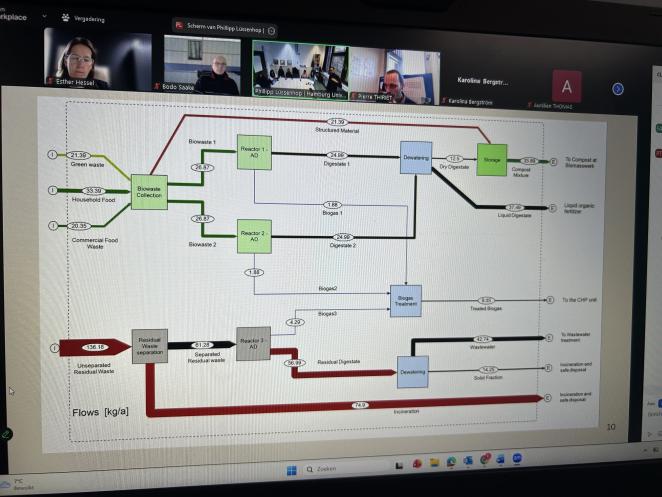
In already 21 showcases, the CLOSECYCLE partners are upgrading residual wastestreams to usefull end products. Different processes are carried out and applied to obtain these end products. The system of flowcharts helps to visualize both the input and outputs, and the processes used. The flowcharts are an integral part of the pilots and reporting. Coming year, on the website, every pilot is presented in a flowchart. In addition to information about the residual flows, the flowcharts also show quantities of input and output flows.
Share this article: